The Admin Dashboard is visible to users with Admin or Super Admin access. Merchant-level users see a scoped view limited to their own Entity.
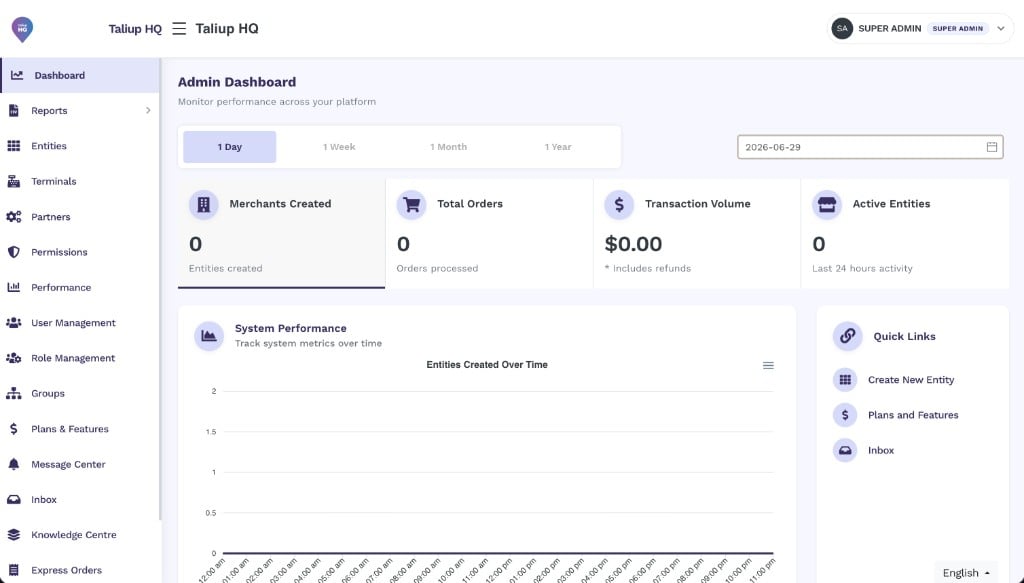
The Taliup HQ Admin Dashboard showing the time filter, KPI cards, System Performance chart, and Quick Links.
Time filter
The filter bar at the top of the dashboard controls the date range applied to every KPI card and every chart on the page. Switching the filter updates all data instantly — no page reload required.The Active Entities KPI card always reflects the last 24 hours of activity regardless of the time filter selected. All other cards and charts respond to the filter.
KPI cards
Four summary cards appear at the top of the dashboard. Each shows a single metric for the selected time period at a glance.Merchants Created
Displays the number of new Entities created on the platform during the selected time period. Use this to track merchant onboarding pace — a sudden drop may indicate a process issue; a spike may follow a sales campaign or partner push.Total Orders
The total number of orders processed across all active Entities during the selected time period. An order is counted when it is submitted through Taliup POS or the Virtual Terminal, regardless of payment outcome.Transaction Volume
The total dollar value of all transactions processed during the selected time period. Refunds are included and reduce the displayed total — the figure represents net transaction volume rather than gross revenue.Active Entities
The number of distinct Entities that recorded at least one order or transaction in the last 24 hours. This card is always fixed to the last 24 hours and does not change when the time filter is adjusted. Use it as a pulse check on how many merchants are actively transacting right now.Charts
Four chart panels appear below the KPI cards. All charts respond to the time filter.System Performance — Entities Created Over Time
A line chart plotting the number of new Entities created over the selected period, broken down by the granularity that fits the filter (hourly for 1 Day, daily for 1 Week and 1 Month, weekly for 1 Year). Use this chart to:- Spot onboarding trends and growth patterns.
- Identify periods of unusually high or low merchant sign-up activity.
- Correlate merchant creation peaks with external events such as sales campaigns or partner launches.
Active Entities
A chart showing how many Entities recorded activity (at least one order or transaction) across the selected time period, broken down by the same time granularity as the System Performance chart. Flat or declining lines here alongside high transaction volume may indicate activity is concentrating in a smaller number of high-volume merchants.Payment Methods
A breakdown of transactions by payment method — Cash, Card, and Other — across all Entities in the selected period. Use this chart to understand the payment mix on the platform:- A high Cash share may indicate merchants are using Taliup POS primarily as an order management tool.
- Card is the primary revenue-generating method and typically the largest segment.
- Other captures any payment recorded outside of cash and card processing (for example, check or store credit).
Entity Category Breakdown
A distribution of Entities by their assigned category (for example, Retail, Restaurant, Service). This gives an overview of the merchant mix on the platform and is useful for:- Understanding which verticals make up the majority of the merchant base.
- Identifying underserved categories with growth potential.
- Filtering operational focus when supporting specific merchant types.