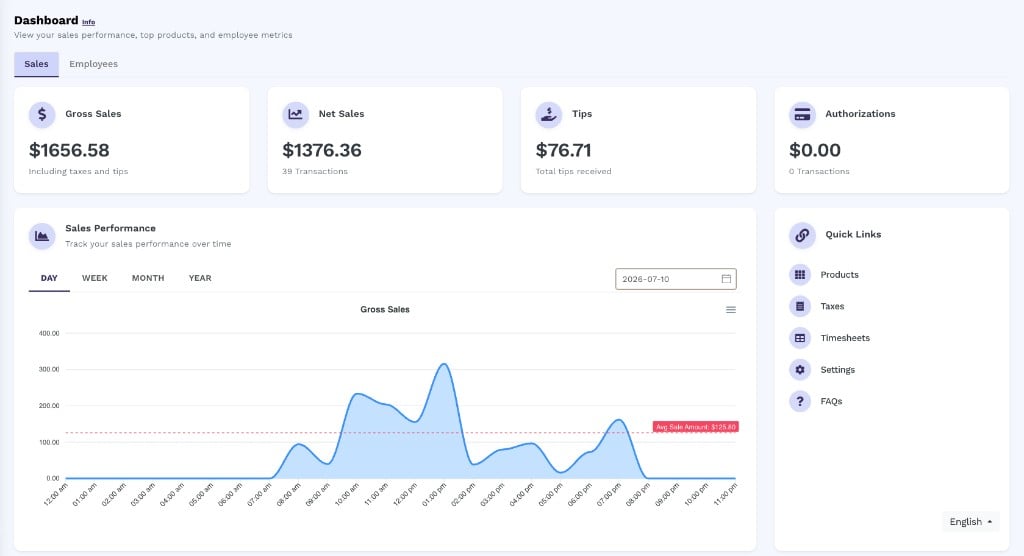
The merchant Dashboard showing the Sales tab with KPI cards, a Sales Performance chart, and Quick Links sidebar.
Sales tab
KPI cards
The four metric cards at the top of the Sales tab update whenever you change the time period in the Sales Performance chart.
The four KPI cards showing Gross Sales, Net Sales, Tips, and Authorizations for the selected period.
Sales Performance chart
The Sales Performance chart plots Gross Sales over time as a shaded area chart. A dashed red reference line marks the average sale amount for the selected period. Hovering over the chart shows a tooltip with the exact gross sales value at that time.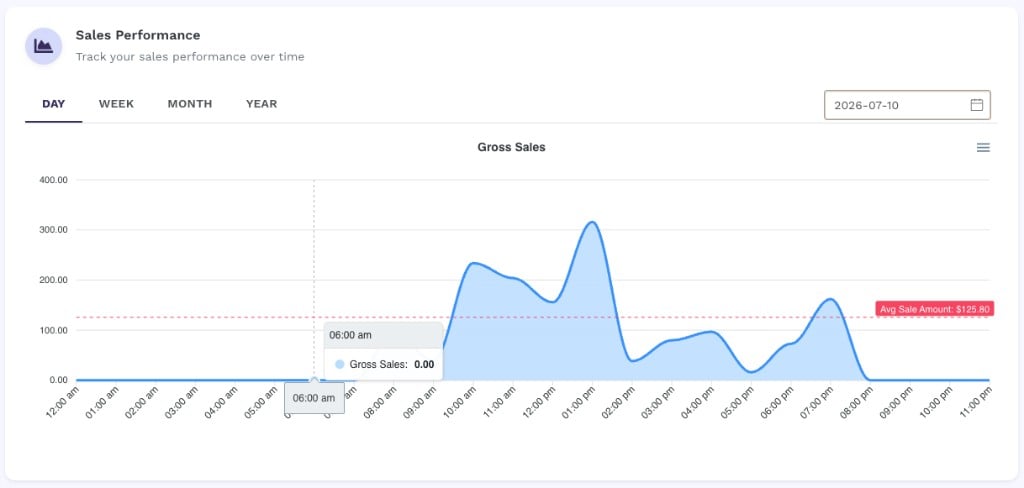
The Sales Performance chart for July 10, 2026 showing Gross Sales by hour, with a tooltip at 06:00 am and the average sale amount reference line at $125.80.
Quick Links
The Quick Links sidebar provides one-click navigation to the most-used sections of your merchant portal:- Products — manage your product catalog
- Taxes — configure tax rates
- Timesheets — view employee time records
- Settings — adjust entity configuration
- FAQs — access help documentation
Summary
The Summary section is a detailed financial breakdown for the selected period.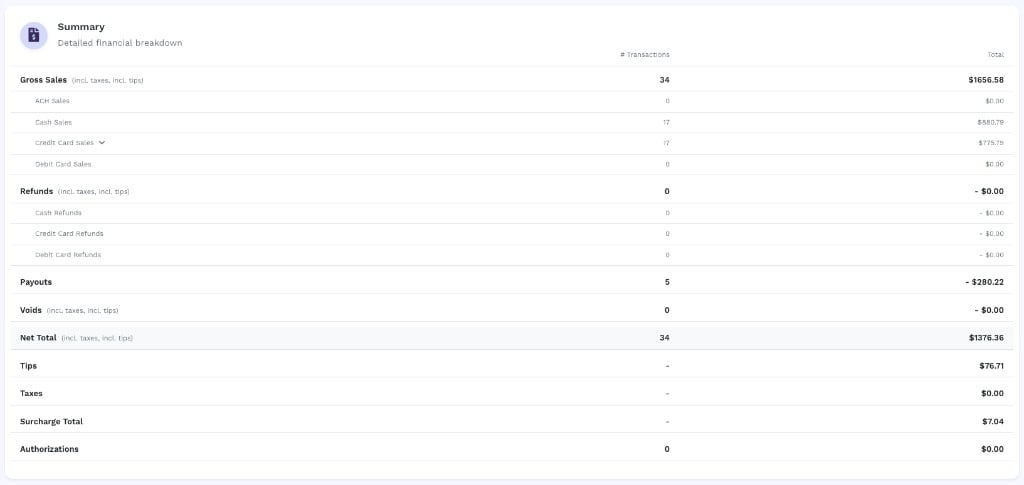
The Summary table showing a hierarchical breakdown of Gross Sales, Refunds, Payouts, Voids, Net Total, Tips, Taxes, Surcharge Total, and Authorizations.
Top Products
The Top Products table lists up to 20 of your best-selling products (custom products excluded), ranked by units sold.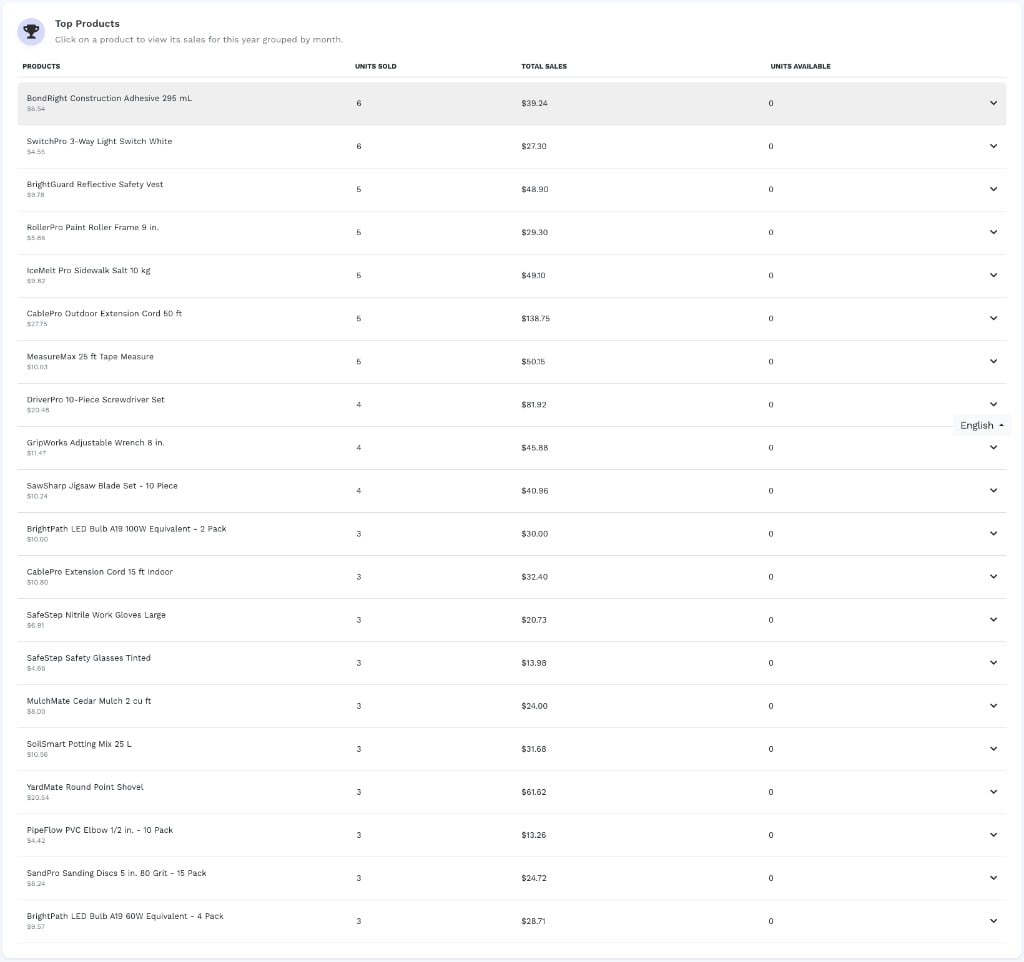
The Top Products table listing up to 20 best-selling products ranked by units sold, with expandable rows for monthly sales detail.
Sales Distribution
The Sales Distribution section shows a breakdown of your sales by category with a Top Selling Products (Quantity) pie chart. This gives a visual overview of which products drive the most volume.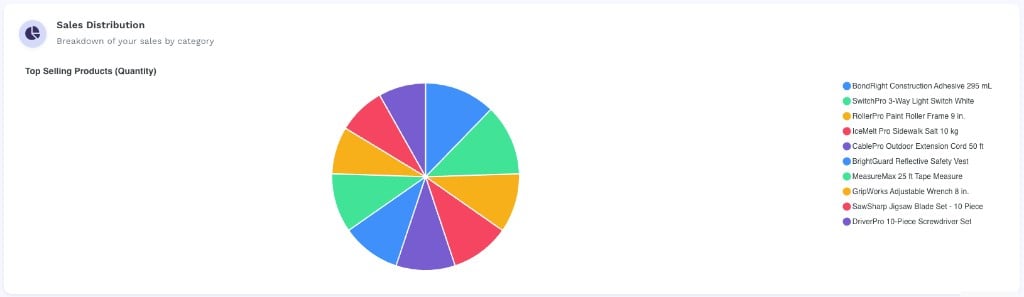
Sales Distribution pie chart showing Top Selling Products by quantity, with a color-coded legend.
Employees tab
The Employees tab contains three sections for analyzing individual employee performance within your location.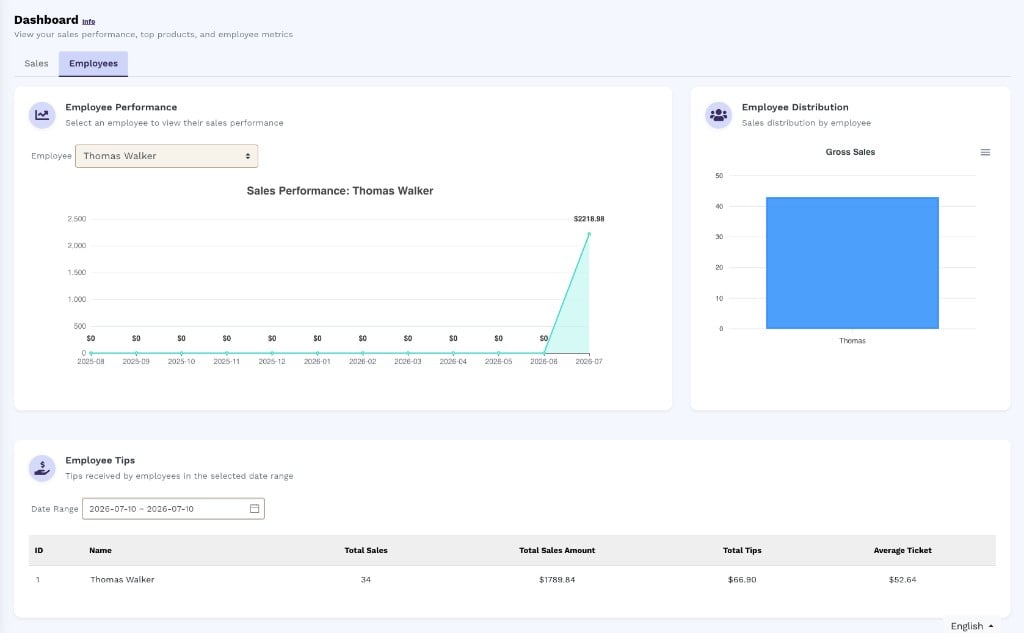
The Employees tab with Thomas Walker selected, showing the Employee Performance chart, Employee Distribution bar chart, and Employee Tips table.
Employee Performance
Select an employee from the Employee dropdown to display a monthly time-series chart of their gross sales over the rolling 12-month period.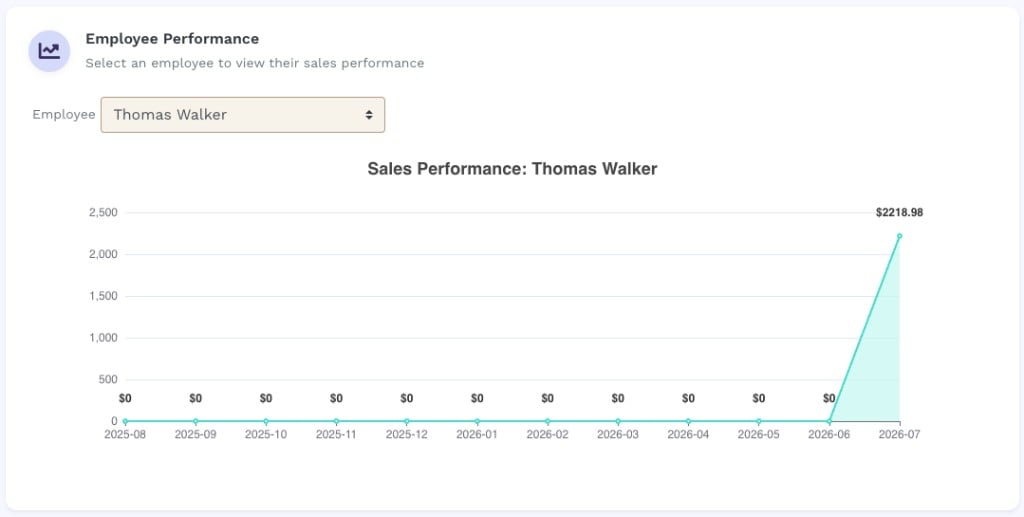
Employee Performance chart for Thomas Walker showing a peak of $2218.98 in July 2026.
Employee Distribution
The Employee Distribution card shows a bar chart of Gross Sales grouped by employee, giving a quick visual comparison of sales volume across your team.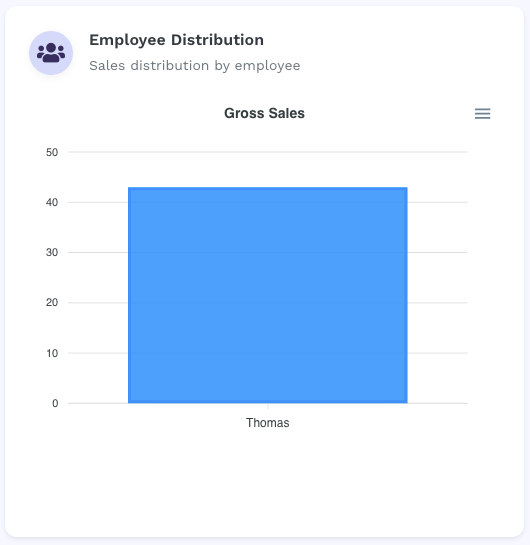
Employee Distribution bar chart showing Gross Sales by employee.
Employee Tips
The Employee Tips table shows tips received by each employee within a date range you specify.
Employee Tips table showing Thomas Walker with 34 sales, $1789.84 in sales, $66.90 in tips, and a $52.64 average ticket for July 10, 2026.