> ## Documentation Index
> Fetch the complete documentation index at: https://docs.taliuphq.com/llms.txt
> Use this file to discover all available pages before exploring further.
# Dashboard
> View your sales performance, top products, and employee metrics for your merchant location.
The Dashboard is the home screen for every merchant in Taliup HQ. It gives you an at-a-glance view of sales activity, financial summaries, and employee performance — all scoped to your location and timezone.
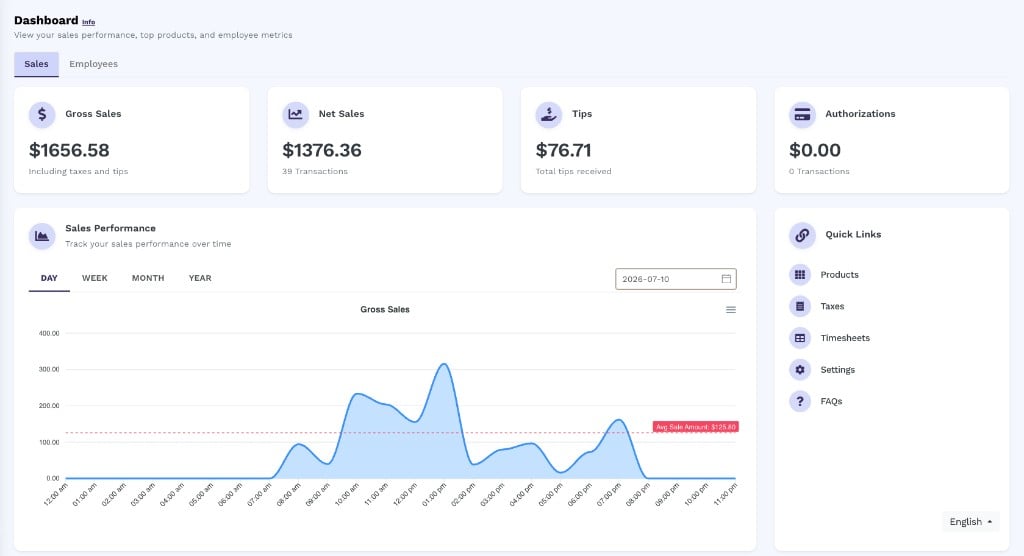 The dashboard is divided into two tabs: **Sales** and **Employees**.
***
## Sales tab
### KPI cards
The four metric cards at the top of the Sales tab update whenever you change the time period in the Sales Performance chart.
The dashboard is divided into two tabs: **Sales** and **Employees**.
***
## Sales tab
### KPI cards
The four metric cards at the top of the Sales tab update whenever you change the time period in the Sales Performance chart.
 | Card | What it shows |
| ------------------ | ----------------------------------------------------------- |
| **Gross Sales** | Total revenue including taxes and tips |
| **Net Sales** | Revenue after refunds and voids, plus the transaction count |
| **Tips** | Total tip amount collected in the period |
| **Authorizations** | Pre-authorized (open tab) total and transaction count |
### Sales Performance chart
The Sales Performance chart plots **Gross Sales** over time as a shaded area chart. A dashed red reference line marks the **average sale amount** for the selected period. Hovering over the chart shows a tooltip with the exact gross sales value at that time.
| Card | What it shows |
| ------------------ | ----------------------------------------------------------- |
| **Gross Sales** | Total revenue including taxes and tips |
| **Net Sales** | Revenue after refunds and voids, plus the transaction count |
| **Tips** | Total tip amount collected in the period |
| **Authorizations** | Pre-authorized (open tab) total and transaction count |
### Sales Performance chart
The Sales Performance chart plots **Gross Sales** over time as a shaded area chart. A dashed red reference line marks the **average sale amount** for the selected period. Hovering over the chart shows a tooltip with the exact gross sales value at that time.
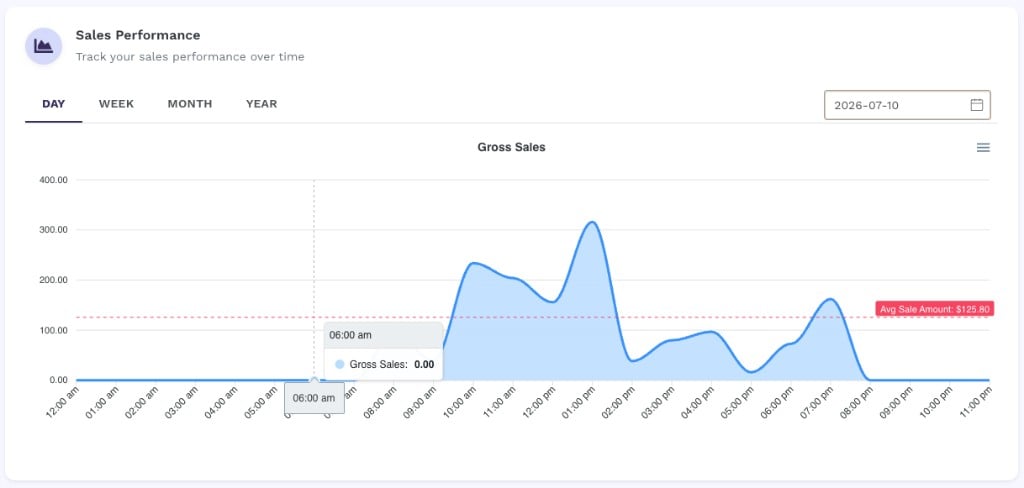 Use the period tabs to change the granularity:
| Tab | Data granularity | Date input |
| --------- | ------------------------------------- | ------------------------ |
| **DAY** | Hourly breakdown for a single date | Date picker (YYYY-MM-DD) |
| **WEEK** | Daily breakdown for an ISO week | Week-number picker |
| **MONTH** | Daily breakdown for a calendar month | Month picker (YYYY-MM) |
| **YEAR** | Monthly breakdown for a calendar year | Year picker (YYYY) |
Selecting a different period or date immediately refreshes the KPI cards and chart data via an AJAX call — no full page reload required.
### Quick Links
The Quick Links sidebar provides one-click navigation to the most-used sections of your merchant portal:
* **Products** — manage your product catalog
* **Taxes** — configure tax rates
* **Timesheets** — view employee time records
* **Settings** — adjust entity configuration
* **FAQs** — access help documentation
### Summary
The Summary section is a detailed financial breakdown for the selected period.
Use the period tabs to change the granularity:
| Tab | Data granularity | Date input |
| --------- | ------------------------------------- | ------------------------ |
| **DAY** | Hourly breakdown for a single date | Date picker (YYYY-MM-DD) |
| **WEEK** | Daily breakdown for an ISO week | Week-number picker |
| **MONTH** | Daily breakdown for a calendar month | Month picker (YYYY-MM) |
| **YEAR** | Monthly breakdown for a calendar year | Year picker (YYYY) |
Selecting a different period or date immediately refreshes the KPI cards and chart data via an AJAX call — no full page reload required.
### Quick Links
The Quick Links sidebar provides one-click navigation to the most-used sections of your merchant portal:
* **Products** — manage your product catalog
* **Taxes** — configure tax rates
* **Timesheets** — view employee time records
* **Settings** — adjust entity configuration
* **FAQs** — access help documentation
### Summary
The Summary section is a detailed financial breakdown for the selected period.
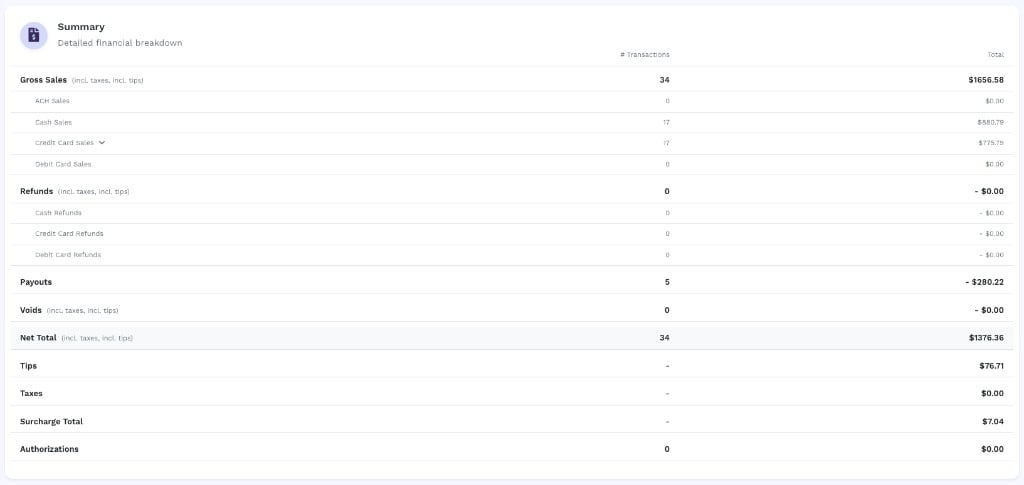 The table is organized into the following rows:
| Row | Description |
| --------------------- | --------------------------------------------------------------------------------------------------------- |
| **Gross Sales** | All completed transactions (incl. taxes, incl. tips) |
| — ACH Sales | Bank transfer transactions |
| — Cash Sales | Cash tender transactions |
| — Gift Card Sales | Gift card redemptions (shown when applicable) |
| — Credit Card Sales | Card-present credit transactions; click the chevron to expand by card type (Visa, Mastercard, Amex, etc.) |
| — Debit Card Sales | Debit card transactions |
| — EBT Sales | EBT transactions (shown when applicable) |
| **Refunds** | Refunded transactions (negative values) |
| — Cash Refunds | Refunds applied to cash tender |
| — Credit Card Refunds | Refunds applied to credit cards |
| — Debit Card Refunds | Refunds applied to debit cards |
| **Payouts** | Cash payouts recorded at the terminal (negative values) |
| **Voids** | Voided transactions (negative values) |
| **Net Total** | Gross Sales minus Refunds, Payouts, and Voids |
| **Tips** | Total tips collected |
| **Taxes** | Total taxes collected |
| **Surcharge Total** | Total surcharge collected |
| **Authorizations** | Open pre-authorized amounts not yet captured |
### Top Products
The Top Products table lists up to 20 of your best-selling products (custom products excluded), ranked by units sold.
The table is organized into the following rows:
| Row | Description |
| --------------------- | --------------------------------------------------------------------------------------------------------- |
| **Gross Sales** | All completed transactions (incl. taxes, incl. tips) |
| — ACH Sales | Bank transfer transactions |
| — Cash Sales | Cash tender transactions |
| — Gift Card Sales | Gift card redemptions (shown when applicable) |
| — Credit Card Sales | Card-present credit transactions; click the chevron to expand by card type (Visa, Mastercard, Amex, etc.) |
| — Debit Card Sales | Debit card transactions |
| — EBT Sales | EBT transactions (shown when applicable) |
| **Refunds** | Refunded transactions (negative values) |
| — Cash Refunds | Refunds applied to cash tender |
| — Credit Card Refunds | Refunds applied to credit cards |
| — Debit Card Refunds | Refunds applied to debit cards |
| **Payouts** | Cash payouts recorded at the terminal (negative values) |
| **Voids** | Voided transactions (negative values) |
| **Net Total** | Gross Sales minus Refunds, Payouts, and Voids |
| **Tips** | Total tips collected |
| **Taxes** | Total taxes collected |
| **Surcharge Total** | Total surcharge collected |
| **Authorizations** | Open pre-authorized amounts not yet captured |
### Top Products
The Top Products table lists up to 20 of your best-selling products (custom products excluded), ranked by units sold.
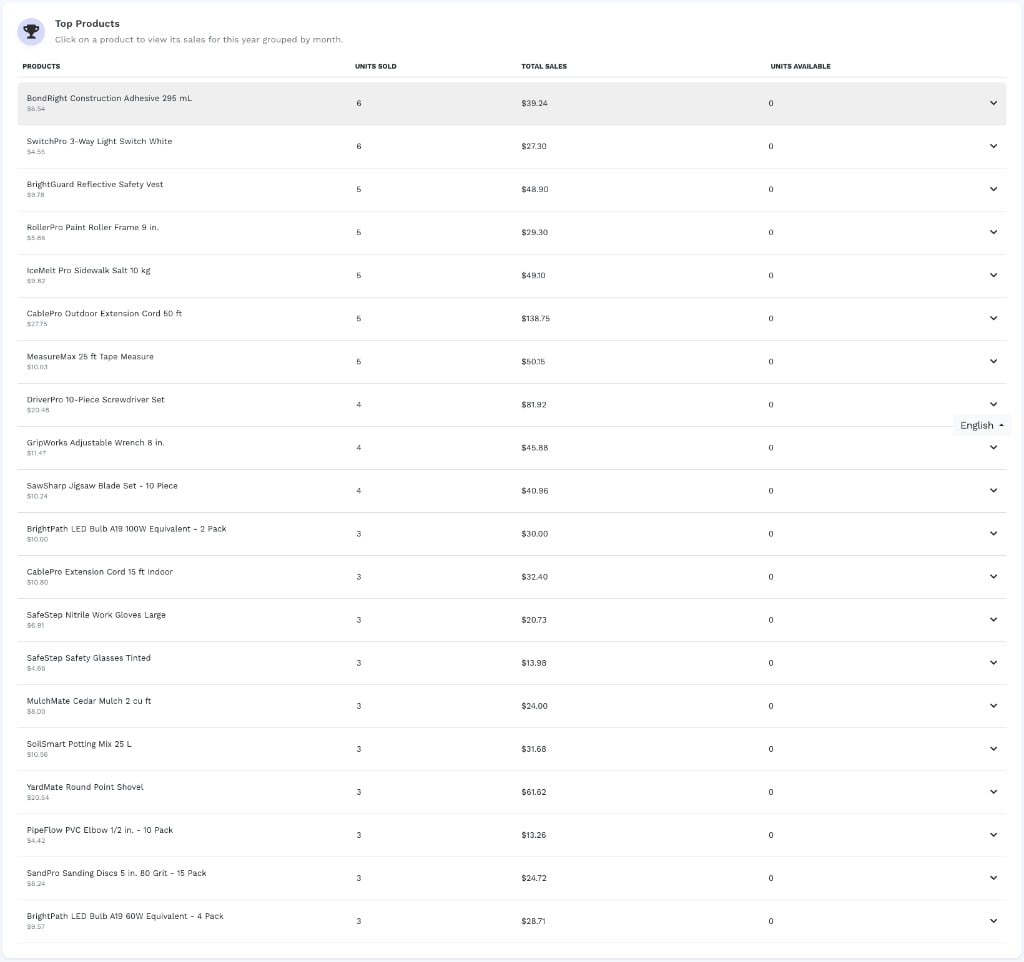 | Column | Description |
| ------------------- | ------------------------------- |
| **Products** | Product name and unit price |
| **Units Sold** | Total quantity sold |
| **Total Sales** | Total revenue from this product |
| **Units Available** | Current inventory count |
Click any product row to expand a monthly sales breakdown for the current year.
### Sales Distribution
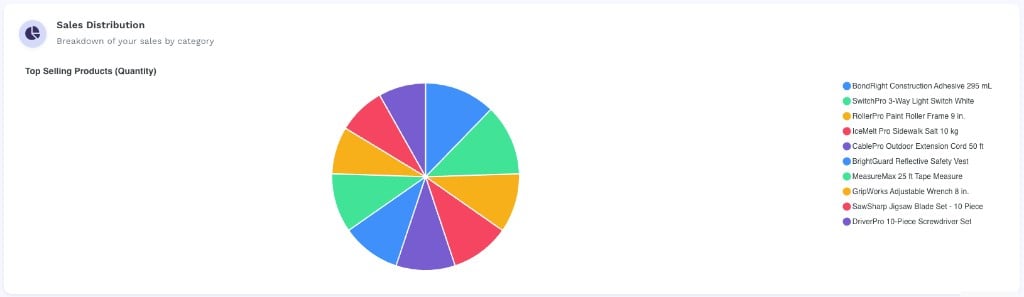
The Sales Distribution section shows a breakdown of your sales by category with a **Top Selling Products (Quantity)** pie chart. This gives a visual overview of which products drive the most volume.
| Column | Description |
| ------------------- | ------------------------------- |
| **Products** | Product name and unit price |
| **Units Sold** | Total quantity sold |
| **Total Sales** | Total revenue from this product |
| **Units Available** | Current inventory count |
Click any product row to expand a monthly sales breakdown for the current year.
### Sales Distribution
The Sales Distribution section shows a breakdown of your sales by category with a **Top Selling Products (Quantity)** pie chart. This gives a visual overview of which products drive the most volume.
 ***
## Employees tab
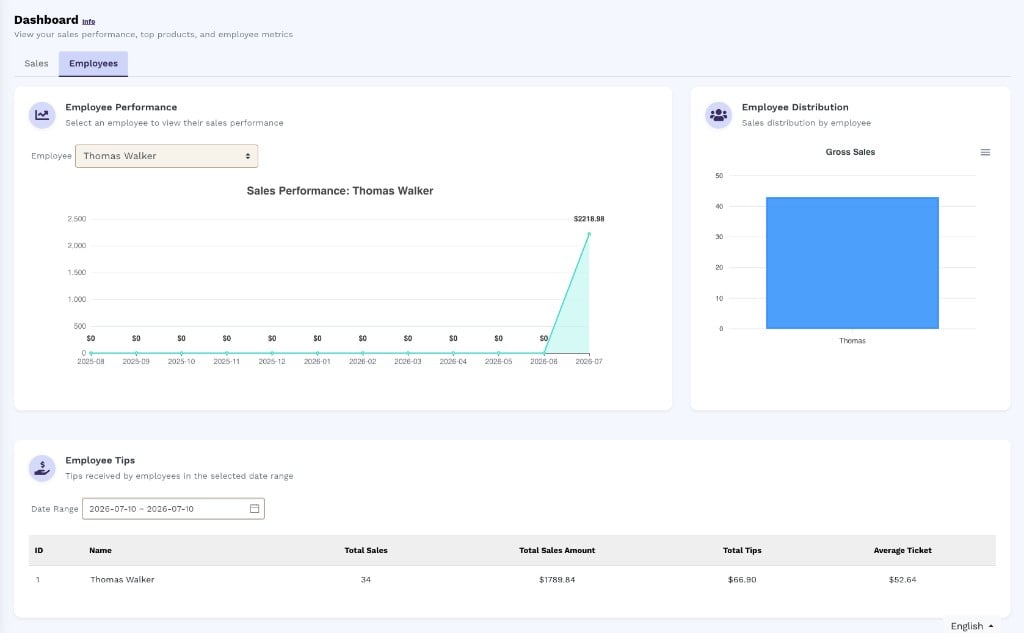
The Employees tab contains three sections for analyzing individual employee performance within your location.
***
## Employees tab
The Employees tab contains three sections for analyzing individual employee performance within your location.
 ### Employee Performance
Select an employee from the **Employee** dropdown to display a monthly time-series chart of their gross sales over the rolling 12-month period.
### Employee Performance
Select an employee from the **Employee** dropdown to display a monthly time-series chart of their gross sales over the rolling 12-month period.
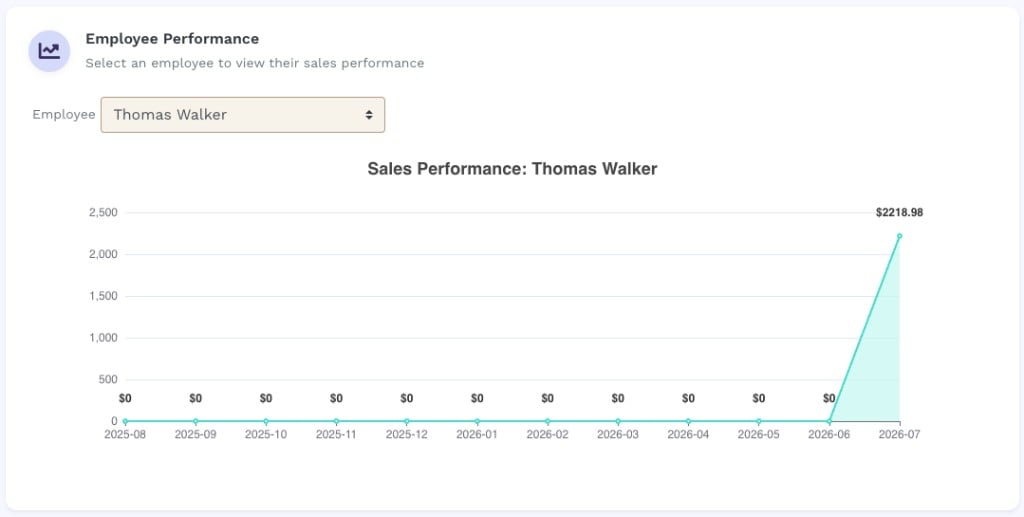 When no employee is selected, the chart area displays a **No Employee selected** placeholder. Once an employee is chosen, the chart loads automatically.
### Employee Distribution
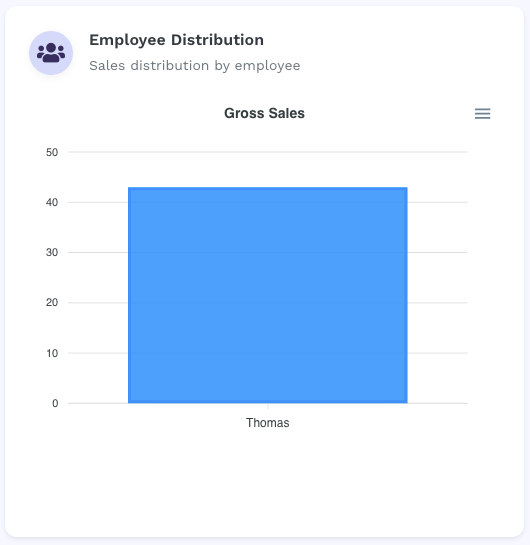
The Employee Distribution card shows a bar chart of **Gross Sales** grouped by employee, giving a quick visual comparison of sales volume across your team.
When no employee is selected, the chart area displays a **No Employee selected** placeholder. Once an employee is chosen, the chart loads automatically.
### Employee Distribution
The Employee Distribution card shows a bar chart of **Gross Sales** grouped by employee, giving a quick visual comparison of sales volume across your team.
 ### Employee Tips
The Employee Tips table shows tips received by each employee within a date range you specify.
### Employee Tips
The Employee Tips table shows tips received by each employee within a date range you specify.
 Use the **Date Range** picker to filter the tips table by a custom start and end date. The table columns are:
| Column | Description |
| ---------------------- | ------------------------------------------------------------ |
| **ID** | Employee record ID |
| **Name** | Employee full name |
| **Total Sales** | Number of transactions attributed to this employee |
| **Total Sales Amount** | Gross revenue from this employee's transactions |
| **Total Tips** | Total tips received by this employee |
| **Average Ticket** | Average transaction value (Total Sales Amount ÷ Total Sales) |
***
## Data scope
All dashboard figures are scoped to your merchant entity and calculated in your entity's configured **timezone**. Dates and time groupings (hourly, daily, weekly, monthly, yearly) all respect this timezone, so sales that occur near midnight are attributed to the correct local business day.
Use the **Date Range** picker to filter the tips table by a custom start and end date. The table columns are:
| Column | Description |
| ---------------------- | ------------------------------------------------------------ |
| **ID** | Employee record ID |
| **Name** | Employee full name |
| **Total Sales** | Number of transactions attributed to this employee |
| **Total Sales Amount** | Gross revenue from this employee's transactions |
| **Total Tips** | Total tips received by this employee |
| **Average Ticket** | Average transaction value (Total Sales Amount ÷ Total Sales) |
***
## Data scope
All dashboard figures are scoped to your merchant entity and calculated in your entity's configured **timezone**. Dates and time groupings (hourly, daily, weekly, monthly, yearly) all respect this timezone, so sales that occur near midnight are attributed to the correct local business day.